Predictive maintenance: Delivering impactful business outcomes through Data & Analytics

The first part on this topic consisted of what is predictive maintenance, some key concepts and an abstract perspective on how it can be implemented in a concept scenario. Following these notions, this part focuses on a demo of a predictive maintenance setup using Power BI™ as the visualization interface.
To perform this simulation, an open source dataset was used. The dataset contains information from innumerous sensors attached to several machines at a manufacturing plant. This scenario can be extrapolated to other industrial applications including medical device health, cold-chain monitoring or HVAC products.
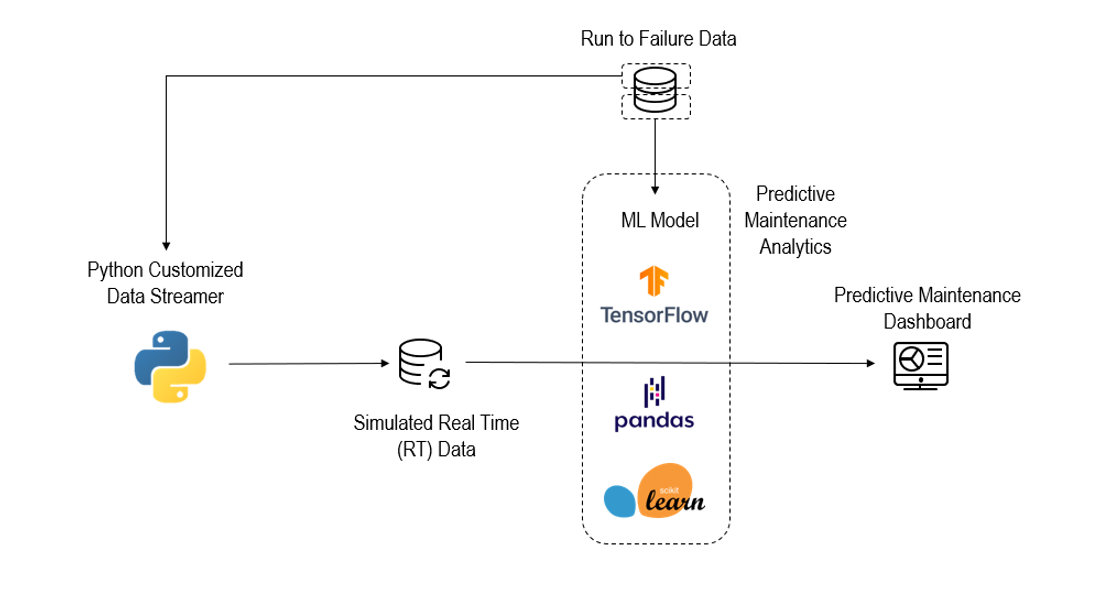
Below is an example of environment schematic. Designed application uses a Python back-end and Power BI™ frontend.
Data Acquisition
From the data source, 70% was used to build the predictive maintenance model (training and testing) and the remaining section was stored to be streamed into the model the same way real data would be. The Python data streamer works in a similar way to a database: every time the model wants to evaluate the resources at a certain timestamp, it sends a signal to the Python orchestrator and it sends the stored value subsequent to the latest one sent to the model. Since models are agnostic to data source (it can be obtained from a real time sensor or manually requested) its behavior would be replicated in a real case scenario.
All the data is cleansed between acquisition and model feed, ensuring valid format. The model is also robust enough to deal with missing values as there is a data validation step before the prediction step, which also feeds data to the interface in case of irregularities.
Predictive Model
For this type of problem, where the input (sensor readings) and output (remaining useful life) is known, the type of algorithm to be applied falls under the supervised learning category. In supervised learning, the task of the algorithm is to learn a function by mapping the input, which is labeled data, to the output. Among the available options, this simulation tested GLM, Gradient Tree Boosting, and Random Forests.
In addition to choosing an algorithm, there are other parameters to take into account when dealing with machine learning. These are noise, a sufficient amount of data, overfitting and bias-variance tradeoff. In this particular case noise is not an issue as most of the data is independent from human errors and the sensors are quite reliable. The quantity of data is not an issue as well since there is an extensive amount gathered in the dataset. Overfitting can be minimized by a process called cross-validation which consists of splitting the data-set into training and testing sets, making the algorithm test its performance for different data combinations.
Bias-variance tradeoff is a common problem, where normally mathematical models are tweaked to increase the bias in order to better explain the variance in the data – this means that an algorithm should be flexible enough to fit data (less flexibility implies more bias) without showing high variance (higher the variance, the worse the model will perform). A balance between these factors needs to be achieved in order to obtain a reliable model that can accurately predict outcomes but also be resilient regarding “unexpected” data values.
The chosen algorithm was the Random Forest with a Lasso regularization technique to ensure that a good trade-off between bias and variance was achieved, thus minimizing overfitting and reaching a prediction accuracy of 88% (this means that in 88% of the cases the algorithm was predicting the right remaining useful life of the machine). Please note that this value can be misleading regarding the quality of the model, because in early cycles it is quite difficult to predict what will actually be the useful life of a brand-new piece of equipment. Considering only cycles above the 200 (around half the average of the life of equipment in this dataset) the model accuracy jumps to 93%, and 97.6% in the last 50 cycles.
Display Interface
The chosen interface to demonstrate a predictive maintenance setup was Power BI™ tool. Minimal processing was done using this tool, just enough to channel data into different tables to feed each of the visualizations (graphics) shown. Power BI™ is a common tool that most companies use to elaborate studies or reports for business intelligence purposes, but with its capacity to integrate other platforms (SAP S4/Hana, Azure, Databases) it is a good candidate for companies to integrate other analytics services such as predictive maintenance.
The interface created for this simulation purpose consists of a two-page Power BI™ application where the first page is a status reference, containing only categorical representation derived from the data obtained, and a second page dedicated to equipment monitoring where sensor readings are displayed.
Figure 2 is a showcase of the status reference, where the interface is divided into two visual fields. The first one, which can also be referred to as the header, contains a series of selection options regarding the machines (Unit ID), sensors (Sensor ID), Operational Settings and the cycle. For each unit advanced in the cycle slicer a python engine streams the data correspondent from the equipment database and the model is applied and its output processed into the current visualization.
Below is an example of Power BI™ screen portraying the status overview. Only categorical data is shown, derived from the sensor collected data.
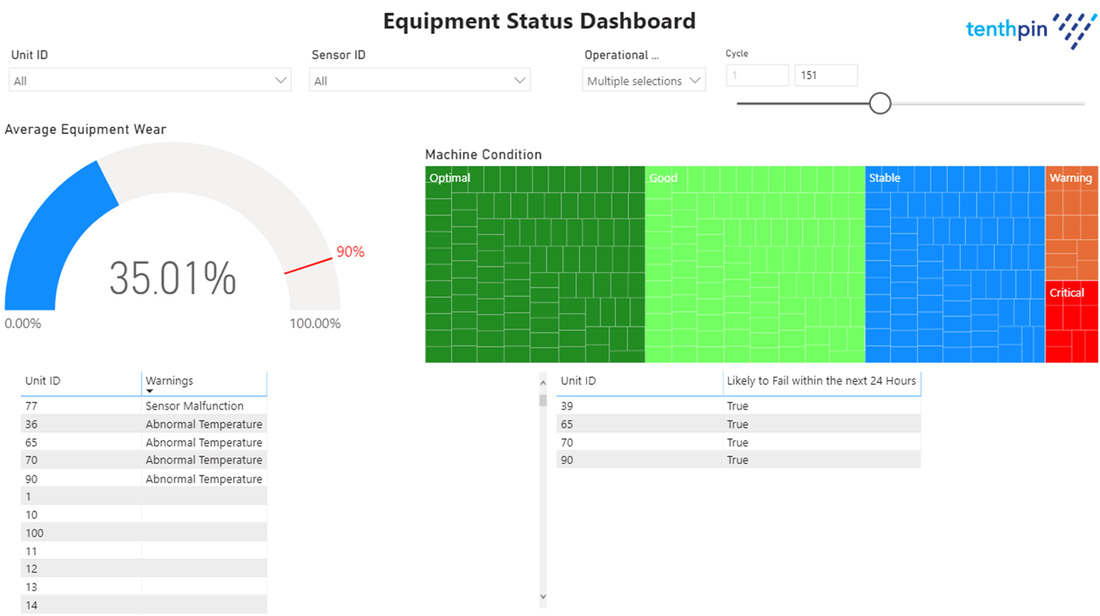
The KPIs displayed on the status reference are: Average Equipment Wear, Machine Condition (from Optimal to Critical based on the predicted remaining useful life), a table containing some trigger-based information from the sensor readings (for instance if there is not a signal from a sensor it shows “Sensor Malfunction” or if temperature levels rise above a predetermined threshold, normally provided by the manufacturer or taken from the data, an “Abnormal Temperature” warning is displayed) and a table highlighting which machines, from the critical set, are predicted to fail within the next 24 hours (it sets a unit to True if the estimated number of cycles left is less than 24 hours).
Many of these indicators are applicable for multiple industrial purposes. For instance predicting the equipment wear is interesting for applications like HVAC or medical health device as they allow to understand status of equipments and feed these insights to operational management teams that can organize replacements, repairing and evaluate the quality of their products/setups. Use of triggers monitoring temperature play a key role in cold-chain transportation as it allows to determine the quality of the products and its storage conditions/transport conditions.
Specific information to single machines can be obtained either by selecting them on the slicers available at the top of the page, or by clicking on a machine either from the Machine Condition or from the bottom-left table since Power BI™ allows interactive slicing as well.
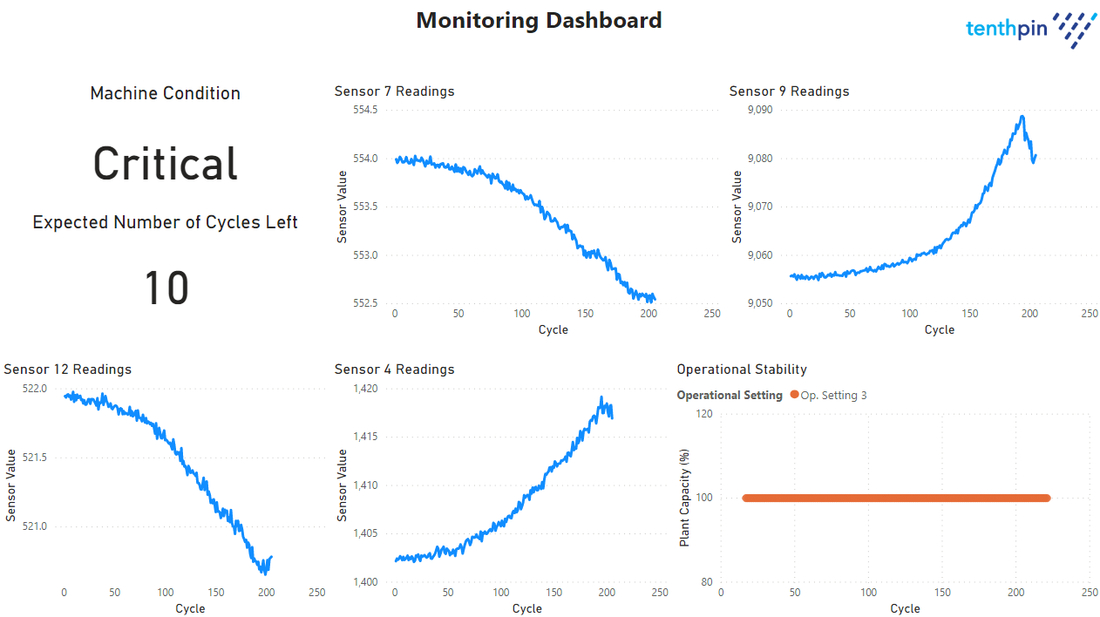
Picture below shows the Monitoring Dashboard. For the current demo, it only shows results when a single unit is selected. It is filtered by the slicing made on the status dashboard and it highlights the status of the machine and the predicted remaining useful life. For the current demo a few sensors that had relevant contributions to the prediction model were picked to display, as well as an operational stability graph. Operational stability refers to the overall status of the plant, across the timescale of the selected machine cycles. If it shows a value below 100, then it means that there is a faulty machine and the production is impacted at some stage.
This type of setup, especially the visualization interfaces, can be tailored to every company setup and data portfolio. The advantage of working with platforms such as Power BI™ is that customization is fast, easy and can be maintained with low IT costs and without specialized teams of resources.
Conclusion
Creating a predictive maintenance setup will provide short term results to a company. By increasing control over industrial processes leveraging data analytics, supervision of manufacturing facilities becomes a more reliable task with reduced possibilities of unexpected events. With cloud migrations becoming a market phenomenon, the implementation of technology such as predictive maintenance is easy to achieve as major providers like Microsoft (Azure Cloud Services) or Amazon (Amazon Web Services) have tools to implement predictive maintenance solutions without very complex architectures and heavy IT support.
Contact our industry experts at Tenthpin if you would like to learn more.
Stay up to date with the latest #Lifeattenthpin #LifeSciences #Pharma #MedDevices #Biotech #Digitalforlife #Thoughtleadership #Medical Technology #AnimalHealth news by following us on Instagram #LifeAtTenthpin Facebook Tenthpin and our Tenthpin LinkedIn corporate page.